Historical data
Because Clicky is focused on real time data, by default all reports will show you "today".
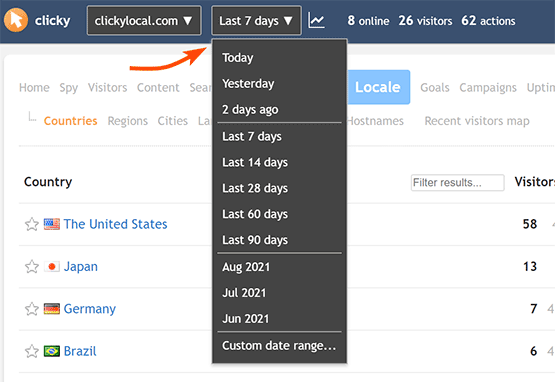
Your historical data is also available, of course. Just use the global date menu in the top navigation area to change the date range you are viewing (see screenshot below). Some convenient shortcuts are displayed, or you can choose a custom date range as well.
As you browse around further reports, the date/range you have selected will continue to apply to those other reports. Note that the larger the range, the longer reports will take to load, so we recommend changing back to "today" as soon as you are done with historical analysis.
When viewing a date
range, the
trend percentage represents the trend vs the previous period. Your trend preference and the date range being viewed can make the calculation a little complicated, so please
read the Trends article in full. The TLDR is that we always try to match up day of week for any kind of historical comparison (trends and
graphs), the one exception being if your trend preference is "the previous day" and you are only viewing a single date.
Historical data is also available for any single data point (e.g. total visitors, or views of your homepage). You can access this by clicking a trend percentage to view a
graph of that item. Most of the time you will see the last 28 days of data by default, but you can change that too.
 0 online
0 visitors
0 actions
0 online
0 visitors
0 actions